本文最后更新于:2024年5月7日 下午

前文介绍了 标准化流 ,本文做简单尝试加深理解。

标准化流

Flow 通过多层可逆映射的精巧变换实现分布之间的转换,通过这种方式拟合复杂的分布;

有些和多层的卷积拟合复杂函数相似的感觉,只是处理的是分布转换。

标准化是因为转换过程必须万分小心,每一步 Flow 的输入输出均为分布,即需要满足和为1 的约束,体积不变,我是这么理解的。

实现流程

原始项目:https://github.com/abdulfatir/normalizing-flows

从中摘出了一个简单示例。

引入 normflows 包

安装包

1
pip install normflows

引入包

1
2
3
import torch
import numpy as np
import normflows as nf

初始分布

用生成器表示,采样得到点位置和该点概率密度

1
q0 = nf.distributions.DiagGaussian(2)

展示

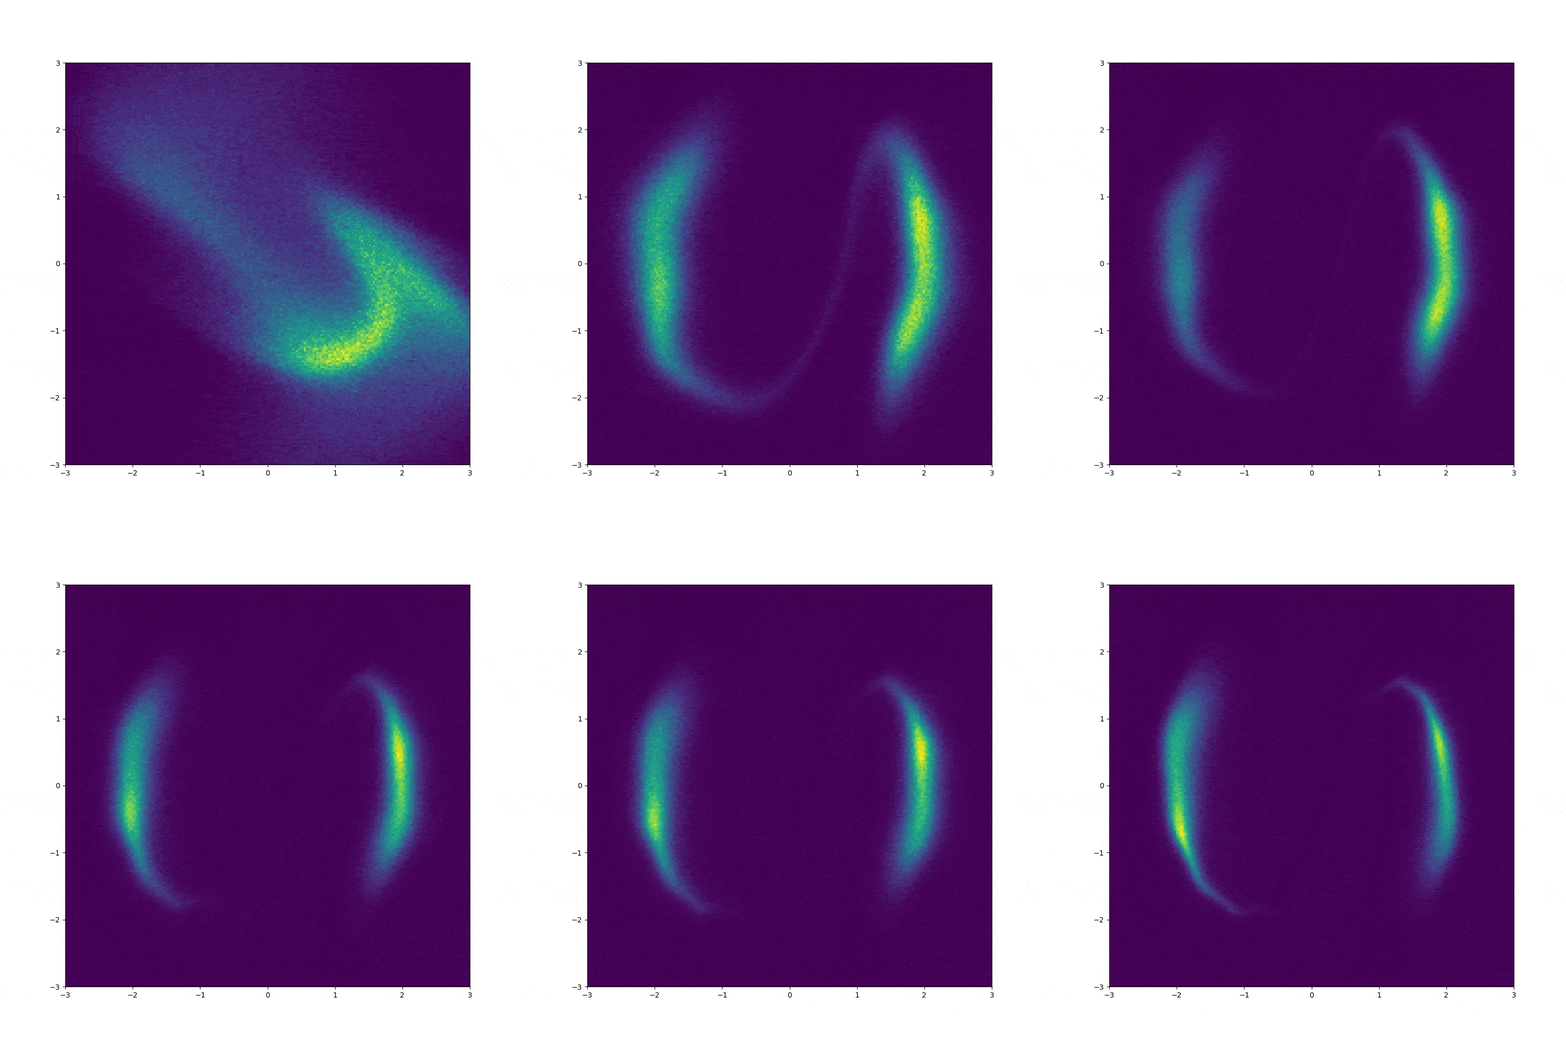
由于是生成器,只能随机生成点,因此生成很多很多点,统计直方图作为初始分布示例

1
2
3
4
5
6
# Plot initial flow distribution
z, _ = nfm.sample(num_samples=2 ** 20)
z_np = z.to('cpu').data.numpy()
plt.figure(figsize=(10, 10))
plt.hist2d(z_np[:, 0].flatten(), z_np[:, 1].flatten(), (grid_size, grid_size), range=[[-3, 3], [-3, 3]])
plt.show()

目标分布

目标分布为评估器,给定点,输出该点的概率密度

1
target = nf.distributions.TwoModes(2, 0.1)

展示

1
2
3
4
5
6
7
8
9
10
# Plot target distribution
grid_size = 200
xx, yy = torch.meshgrid(torch.linspace(-3, 3, grid_size), torch.linspace(-3, 3, grid_size))
z = torch.cat([xx.unsqueeze(2), yy.unsqueeze(2)], 2).view(-1, 2)
log_prob = target.log_prob(z.to(device)).to('cpu').view(*xx.shape)
prob = torch.exp(log_prob)

plt.figure(figsize=(10, 10))
plt.pcolormesh(xx, yy, prob)
plt.show()

Flows

1
2
3
4
K = 16
flows = []
for i in range(K):
flows += [nf.flows.Planar((2,))]

创建最简单的 Planar 流,

模型

1
nfm = nf.NormalizingFlow(q0=q0, flows=flows, p=target)

训练

1
2
3
4
5
6
7
8
9
10
11
12
13
14
15
16
17
18
19
20
21
22
# Train model
max_iter = 20000
num_samples = 2 * 20
anneal_iter = 10000
annealing = True
show_iter = 200


loss_hist = np.array([])

optimizer = torch.optim.Adam(nfm.parameters(), lr=1e-3, weight_decay=1e-4)
for it in tqdm(range(max_iter)):
optimizer.zero_grad()
if annealing:
loss = nfm.reverse_kld(num_samples, beta=np.min([1., 0.01 + it / anneal_iter]))
else:
loss = nfm.reverse_kld(num_samples)
loss.backward()
optimizer.step()

loss_hist = np.append(loss_hist, loss.to('cpu').data.numpy())

整体代码

1
2
3
4
5
6
7
8
9
10
11
12
13
14
15
16
17
18
19
20
21
22
23
24
25
26
27
28
29
30
31
32
33
34
35
36
37
38
39
40
41
42
43
44
45
46
47
48
49
50
51
52
53
54
55
56
57
58
59
60
61
62
63
64
65
66
67
68
69
70
71
72
73
74
75
76
77
78
79
80
81
82
83
84
85
86
87
88
89
90
91
92
93
94
# Import required packages
import torch
import numpy as np
import normflows as nf
import mtutils as mt
from matplotlib import pyplot as plt
from tqdm import tqdm


K = 16
#torch.manual_seed(0)

# Move model on GPU if available
enable_cuda = True
device = torch.device('cuda' if torch.cuda.is_available() and enable_cuda else 'cpu')

flows = []
for i in range(K):
flows += [nf.flows.Planar((2,))]
target = nf.distributions.TwoModes(2, 0.1)

## 初始分布
q0 = nf.distributions.DiagGaussian(2)
nfm = nf.NormalizingFlow(q0=q0, flows=flows, p=target)
nfm.to(device)


# Plot target distribution
grid_size = 200
xx, yy = torch.meshgrid(torch.linspace(-3, 3, grid_size), torch.linspace(-3, 3, grid_size))
z = torch.cat([xx.unsqueeze(2), yy.unsqueeze(2)], 2).view(-1, 2)
log_prob = target.log_prob(z.to(device)).to('cpu').view(*xx.shape)
prob = torch.exp(log_prob)

plt.figure(figsize=(10, 10))
plt.pcolormesh(xx, yy, prob)
plt.show()

# Plot initial flow distribution
z, _ = nfm.sample(num_samples=2 ** 20)
z_np = z.to('cpu').data.numpy()
plt.figure(figsize=(10, 10))
plt.hist2d(z_np[:, 0].flatten(), z_np[:, 1].flatten(), (grid_size, grid_size), range=[[-3, 3], [-3, 3]])
plt.show()


# Train model
max_iter = 20000
num_samples = 2 * 20
anneal_iter = 10000
annealing = True
show_iter = 200


loss_hist = np.array([])

optimizer = torch.optim.Adam(nfm.parameters(), lr=1e-3, weight_decay=1e-4)
for it in tqdm(range(max_iter)):
optimizer.zero_grad()
if annealing:
loss = nfm.reverse_kld(num_samples, beta=np.min([1., 0.01 + it / anneal_iter]))
else:
loss = nfm.reverse_kld(num_samples)
loss.backward()
optimizer.step()

loss_hist = np.append(loss_hist, loss.to('cpu').data.numpy())

# Plot learned distribution
if (it + 1) % show_iter == 0:
torch.cuda.manual_seed(0)
z, _ = nfm.sample(num_samples=2 ** 20)
z_np = z.to('cpu').data.numpy()

plt.figure(1, figsize=(10, 10))
plt.hist2d(z_np[:, 0].flatten(), z_np[:, 1].flatten(), (grid_size, grid_size), range=[[-3, 3], [-3, 3]])
# plt.pause(0.1)
image = mt.convert_plt_to_rgb_image(plt)
mt.cv_rgb_imwrite(image, f"res/{it}.jpg")


# plt.figure(figsize=(10, 10))
# plt.plot(loss_hist, label='loss')
# plt.legend()
# plt.show()

# Plot learned distribution
z, _ = nfm.sample(num_samples=2 ** 20)
z_np = z.to('cpu').data.numpy()
plt.figure(figsize=(10, 10))
plt.hist2d(z_np[:, 0].flatten(), z_np[:, 1].flatten(), (grid_size, grid_size), range=[[-3, 3], [-3, 3]])
plt.show()

实现效果

200 iter / frame

参考资料


文章链接:
https://www.zywvvd.com/notes/study/deep-learning/generation/normalizing-flows/flow-demo/flow-demo/


“觉得不错的话,给点打赏吧 ୧(๑•̀⌄•́๑)૭”

微信二维码

微信支付

支付宝二维码

支付宝支付

Normalizing Flow 理解与实现
https://www.zywvvd.com/notes/study/deep-learning/generation/normalizing-flows/flow-demo/flow-demo/
作者
Yiwei Zhang
发布于
2023年5月23日
许可协议