本文最后更新于:2024年5月7日 下午
代码性能至关重要,但有时难以弄清性能瓶颈的位置,python的
profile包可以解决这个问题并指导提升代码性能。
简介
代码优化的前提是需要了解性能瓶颈在什么地方,程序运行的主要时间是消耗在哪里,对于比较复杂的代码可以借助一些工具来定位,python 内置了丰富的性能分析工具,如 profile, cProfile 与 hotshot 等。其中 Profiler 是 python 自带的一组程序,能够描述程序运行时候的性能,并提供各种统计帮助用户定位程序的性能瓶颈。Python 标准模块提供三种 profilers:cProfile, profile 以及 hotshot。
pycharm 专业版带有 profile 工具,vs code 等其他 ide 的 python 用户就需要自己调用profile了。
性能分析方法
-
引入python自带的
profile或cProfile
1 | |
-
确定需要分析性能的函数
1 | |
我们分析函数
fun的性能
-
性能分析
python 脚本中分析
1 | |
- 输出
1 | |
- 其中输出每列的具体解释如下:
| 参数名称 | 参数信息 |
|---|---|
| ncalls | 表示函数调用的次数 |
| tottime | 表示指定函数的总的运行时间,除掉函数中调用子函数的运行时间 |
| percall | (第一个 percall)等于 tottime/ncalls |
| cumtime | 表示该函数及其所有子函数的调用运行的时间,即函数开始调用到返回的时间 |
| percall | (第二个 percall)即函数运行一次的平均时间,等于 cumtime/ncalls |
| filename:lineno(function) | 每个函数调用的具体信息 |
- 保存日志
如果需要将输出以日志的形式保存,只需要在调用的时候加入另外一个参数。
可以在当前文件夹存下日志信息到prof文件中。
1 | |
命令行分析
如果不想在程序中调用profile库使用,可以在命令行使用命令。
- 运行命令查看性能分析结果
1 | |
- 将性能分析结果保存到result文件
1 | |
读取prof文件中的分析日志
- 可以用
pstats读取prof文件中的日志
1 | |
-
可视化
比较推荐的是使用
snakeviz可视化代码运行时间
- 安装
snakeviz
1 | |
-
运行Python代码的同时用
cProfile保存运行时间数据注意:要用
cProfile,使用profile会导致snakeviz无法读取日志相关错误信息:
1
2
3
4
5
6
7
8
9
10Traceback (most recent call last):
File ".../site-packages/tornado/web.py", line 1413, in _execute
result = method(*self.path_args, **self.path_kwargs)
File ".../site-packages/snakeviz/main.py", line 30, in get
table_rows=table_rows(s), callees=json_stats(s))
File ".../site-packages/snakeviz/stats.py", line 65, in json_stats
(keyfmt(*ck), list(cv)) for ck, cv in stats.stats[k][-1].items())
File ".../site-packages/snakeviz/stats.py", line 65, in <genexpr>
(keyfmt(*ck), list(cv)) for ck, cv in stats.stats[k][-1].items())
TypeError: 'int' object is not iterable相关 issues :
-
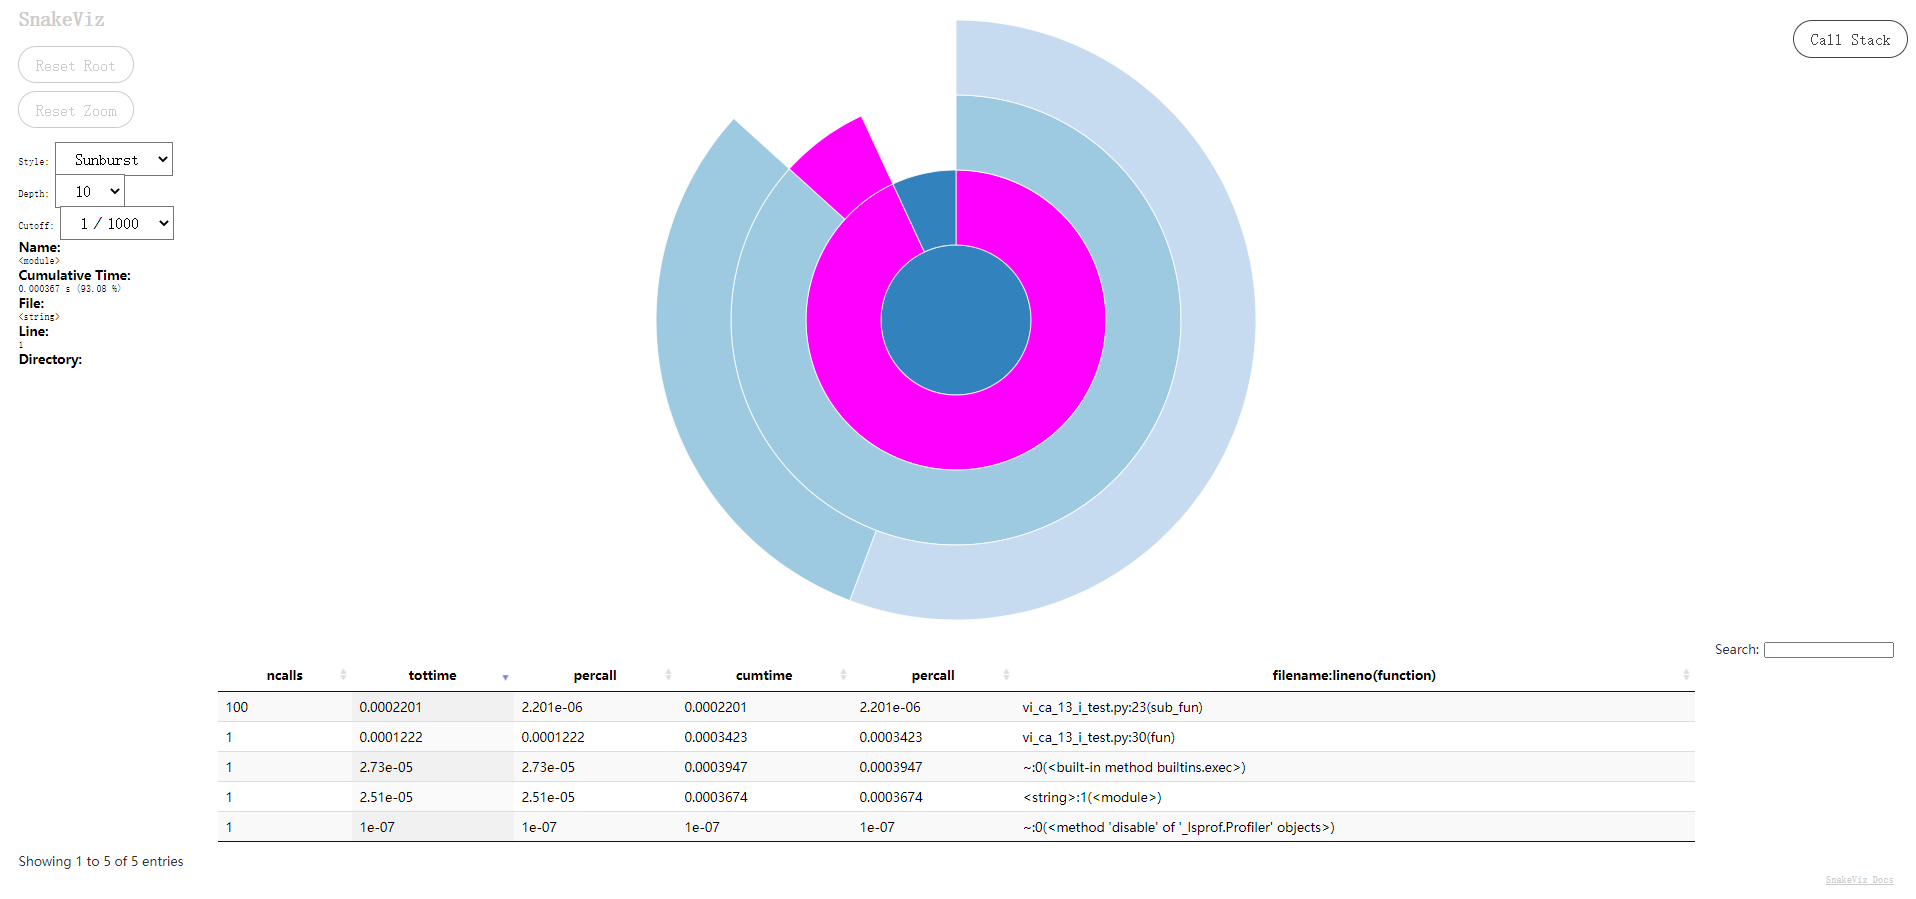
在命令行中调用
snakeviz作用于我们需要观察的日志文件:
1 | |
- 在浏览器中可以看到函数时间消耗信息:
参考资料
- https://www.jb51.net/article/174589.htm
- https://zhuanlan.zhihu.com/p/58535923
- https://blog.csdn.net/weixin_56336619/article/details/115862343
- https://zhuanlan.zhihu.com/p/110105273
文章链接:
https://www.zywvvd.com/notes/coding/python/python-profile/python-profile/
“觉得不错的话,给点打赏吧 ୧(๑•̀⌄•́๑)૭”

微信支付

支付宝支付