本文最后更新于:2024年5月7日 下午
matplotlib.animation是matplotlib的动态图库,本文记录使用方法。
用法介绍
-
matplotlib是 Python 中常用的绘图工具,其中的animation可以绘制动画
语法
-
使用函数:
matplotlib.animation.FuncAnimation -
matplotlib.animation.FuncAnimation(fig, func, frames=None, init_func=None, fargs=None, save_count=None, *, cache_frame_data=True, **kwargs)1
2
3
4
5
6
7
8
9
10
11
12
13
14
15
16
17
18
19
20
21
22
23
24
25
26
27
28
29
30
31
32
33
34
35
36
37
38
39
40
41
42
43
44
45
46
47
48
49
50
51
52
53
54
55
56
57
58
59
60
61
62
63
64
65
66
67
68
69
70
71
72
73
74
75
76
77
78
79
80
81
82
83
84
85
86
87
88
89
90
91
92
93
94
95
96
97
98
99
100
101
102
103
104
105
106
107
108
109
110
111
112
113
114
115
116
117
118
119
120
121
122
123
124
125
126
127
128
129
130
131
132
133
134
135
136
137
138
139
140
141
142
143
144
145
146
147
148
149
150
151
152
153
154
155
156
157
- 参数说明:
| 参数 | 类型 | 含义 |
| ----------------------- | ------------------------------------------------------------ | ------------------------------------------------------------ |
| **fig** | [`Figure`](https://matplotlib.org/stable/api/figure_api.html#matplotlib.figure.Figure) | 用于获取所需事件(如绘制或调整大小)的图形对象。 |
| **func** | callable | 每帧上调用的函数,第一个参数是每帧图像的编号。其他参数可以使用 `funtools.part` 或通过 `fargs` 参数提供。返回值为可遍历的绘图对象:<br />`def func(frame, *fargs) -> iterable_of_artists` |
| **frames** | iterable, int, generator function, or None, optional | 传递 func 和每帧动画的数据源,可以是列表,也可以是数字 (替换为 `range(frames)`) |
| **init_func(callable)** | callable, optional | 一种用于绘制清晰框架的函数。如果没有给出,将使用从帧序列中的第一个项目绘制的结果。这个函数将在第一帧之前调用一次。 |
| **fargs** | tuple or None, optional | 传递给每次调用 func 的附加参数。注意:使用 `functools.partial` 优于 `fargs`。 |
| **save_count** | int, default: 100 | 从帧到缓存的值数的后备。只有当无法从帧中推断出帧的数量时才会使用,例如,当它是一个没有长度的迭代器或生成器时。 |
| **interval** | int, default: 200 | 帧之间的延迟,以毫秒为单位。 |
| **repeat_delay** | int, default: 0 | 如果 repeat 为 True,则连续动画运行之间以毫秒为单位的延迟。 |
| **repeat** | bool, default: True | 当帧序列完成时,动画是否重复。 |
| **blit** | bool, default: False | 是否优化绘图。 |
| **cache_frame_data** | bool, default: True | 是否缓存帧数据。当帧包含大对象时,禁用缓存可能会有帮助。 |
#### 方法
| 方法 | 说明 |
| ------------------------------------------------ | ------------------------------------ |
| `__init__` | 初始化对象。 |
| `new_frame_seq()` | 返回一个新的帧序列信息。 |
| `pause()` | 暂停动画。 |
| `resume()` | 继续动画。 |
| `save(filename[, writer, fps, dpi, codec, ...])` | 通过绘制每一帧将动画保存为电影文件。 |
| `to_html5_video([embed_limit])` | 将动画转换为 HTML5 < video > 标记。 |
| `to_jshtml([fps, embed_frames, default_mode])` | 生成的 HTML 动画。 |
- 通过 `plt.show()` 可以展示动画过程。
- `save` 函数参数 :
| 参数 | 类型 | 描述 |
| --------------------- | ------------------------------------------------------------ | ------------------------------------------------------------ |
| **filename** | str | 输出文件名,例如: `a.gif`, `b.mp4` |
| **writer** | MovieWriter or str, default: rcParams["animation.writer"] (default: 'ffmpeg') | 要使用的 MovieWriter 实例或标识要使用的类的键,如“ ffmpeg”。 |
| **fps** | int, optional | 电影帧速率(每秒)。如果没有设置,帧速率从动画的帧间隔。 |
| **dpi** | float, default: rcParams["savefig.dpi"] (default: 'figure') | 控制电影帧的每英寸点数。加上人物的尺寸(英寸) ,这可以控制电影的大小。 |
| **codec** | str, default: rcParams["animation.codec"] (default: 'h264'). | 要使用的视频编解码器。 |
| **bitrate** | int, default: rcParams["animation.bitrate"] (default: -1) | 电影的比特率,以千比特每秒为单位。更高的值意味着更高质量的电影,但增加文件大小。值 -1允许基础电影编码器选择比特率。 |
| **extra_args** | list of str or None, optional | 传递给基础电影编码器的额外命令行参数。 |
| **metadata** | dict[str, str], default: {} | 输出文件中要包含的元数据的键和值的字典。一些可能有用的关键字包括: 标题、艺术家、类型、主题、版权、 srcform、评论。 |
| **extra_anim** | list, default: [] | 应包含在保存的电影文件中的其他 Animation 对象。 |
| **savefig_kwargs** | dict, default: {} | 传递给用于保存各个帧的每个 savefig 调用的关键字参数。 |
| **progress_callback** | function, optional | 一个回调函数,每个帧都会调用该函数来通知保存进度。它必须有签名 |
### 官方示例
- 官方给出了很多使用示例:https://matplotlib.org/stable/gallery/index.html
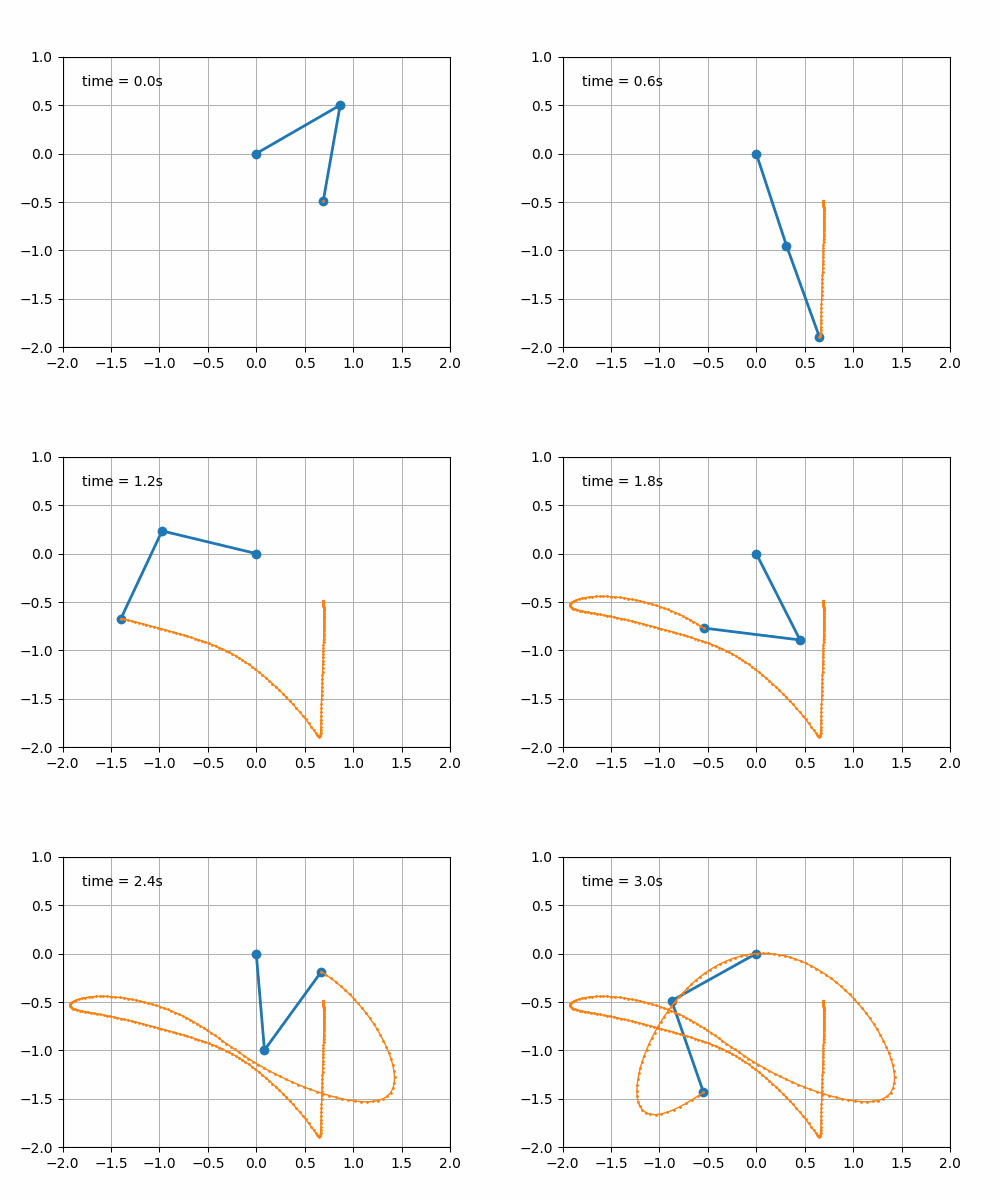
- 取其中一个稍作修改展示出来:
```python
from numpy import sin, cos
import numpy as np
import matplotlib.pyplot as plt
import matplotlib.animation as animation
from collections import deque
G = 9.8 # acceleration due to gravity, in m/s^2
L1 = 1.0 # length of pendulum 1 in m
L2 = 1.0 # length of pendulum 2 in m
L = L1 + L2 # maximal length of the combined pendulum
M1 = 1.0 # mass of pendulum 1 in kg
M2 = 1.0 # mass of pendulum 2 in kg
t_stop = 8 # how many seconds to simulate
history_len = 500 # how many trajectory points to display
def derivs(t, state):
dydx = np.zeros_like(state)
dydx[0] = state[1]
delta = state[2] - state[0]
den1 = (M1+M2) * L1 - M2 * L1 * cos(delta) * cos(delta)
dydx[1] = ((M2 * L1 * state[1] * state[1] * sin(delta) * cos(delta)
+ M2 * G * sin(state[2]) * cos(delta)
+ M2 * L2 * state[3] * state[3] * sin(delta)
- (M1+M2) * G * sin(state[0]))
/ den1)
dydx[2] = state[3]
den2 = (L2/L1) * den1
dydx[3] = ((- M2 * L2 * state[3] * state[3] * sin(delta) * cos(delta)
+ (M1+M2) * G * sin(state[0]) * cos(delta)
- (M1+M2) * L1 * state[1] * state[1] * sin(delta)
- (M1+M2) * G * sin(state[2]))
/ den2)
return dydx
# create a time array from 0..t_stop sampled at 0.02 second steps
dt = 0.01
t = np.arange(0, t_stop, dt)
# th1 and th2 are the initial angles (degrees)
# w10 and w20 are the initial angular velocities (degrees per second)
th1 = 120.0
w1 = 0.0
th2 = -10.0
w2 = 0.0
# initial state
state = np.radians([th1, w1, th2, w2])
# integrate the ODE using Euler's method
y = np.empty((len(t), 4))
y[0] = state
for i in range(1, len(t)):
y[i] = y[i - 1] + derivs(t[i - 1], y[i - 1]) * dt
# A more accurate estimate could be obtained e.g. using scipy:
#
# y = scipy.integrate.solve_ivp(derivs, t[[0, -1]], state, t_eval=t).y.T
x1 = L1*sin(y[:, 0])
y1 = -L1*cos(y[:, 0])
x2 = L2*sin(y[:, 2]) + x1
y2 = -L2*cos(y[:, 2]) + y1
fig = plt.figure(figsize=(5, 4))
ax = fig.add_subplot(autoscale_on=False, xlim=(-L, L), ylim=(-L, 1.))
ax.set_aspect('equal')
ax.grid()
line, = ax.plot([], [], 'o-', lw=2)
trace, = ax.plot([], [], '.-', lw=1, ms=2)
time_template = 'time = %.1fs'
time_text = ax.text(0.05, 0.9, '', transform=ax.transAxes)
history_x, history_y = deque(maxlen=history_len), deque(maxlen=history_len)
def animate(i):
thisx = [0, x1[i], x2[i]]
thisy = [0, y1[i], y2[i]]
if i == 0:
history_x.clear()
history_y.clear()
history_x.appendleft(thisx[2])
history_y.appendleft(thisy[2])
line.set_data(thisx, thisy)
trace.set_data(history_x, history_y)
time_text.set_text(time_template % (i*dt))
return line, trace, time_text
ani = animation.FuncAnimation(
fig, animate, len(y), interval=dt*1000, blit=True)
ani.save('show.gif', writer='pillow', fps=10)
plt.show() -
动画效果:

参考资料
- https://matplotlib.org/stable/api/_as_gen/matplotlib.animation.FuncAnimation.html#matplotlib.animation.FuncAnimation
- https://matplotlib.org/stable/gallery/index.html
- https://www.cnblogs.com/endlesscoding/p/10308111.html
文章链接:
https://www.zywvvd.com/notes/coding/python/matplotlib/animation/animation/
“觉得不错的话,给点打赏吧 ୧(๑•̀⌄•́๑)૭”

微信支付

支付宝支付
Python 使用 matplotlib.animation 绘制动图
https://www.zywvvd.com/notes/coding/python/matplotlib/animation/animation/