本文最后更新于:2024年5月22日 晚上
Folium 是一个基于 Leaflet 的 Python 库,用于将地理数据可视化为地图。本文介绍 Folium 库及其使用方法。
简介
Folium 是一个基于 Leaflet 的 Python 库,用于将地理数据可视化为地图。Leaflet 是一个开源的交互式地图JavaScript库,而 Folium 则提供了一个简单的方式来将这些功能带到 Python 环境中。这对于数据科学家和分析师来说非常有用,因为他们可以在数据分析工作流程中轻松地创建、查看和分享地理空间数据。
folium 建立在 Python 生态系统的数据应用能力和 Leaflet.js 库的映射能力之上,在Python中操作数据,然后通过 folium 在 Leaflet 地图中可视化。folium 相比较于国内百度的 pyecharts 灵活性更强,能够自定义绘制区域,并且展现形式更加多样化。
这个开源库中有许多来自 OpenStreetMap、MapQuest Open、MapQuestOpen Aerial、Mapbox和Stamen 的内建地图元件,而且支持使用 Mapbox 或 Cloudmade 的 API 密钥来定制个性化的地图元件。Folium支持 GeoJSON 和 TopoJSON 两种文件格式的叠加,也可以将数据连接到这两种文件格式的叠加层,最后可使用 color-brewer 配色方案创建分布图。
Folium可以让你用 Python 强大生态系统来处理数据,然后用 Leaflet 地图来展示。Folium内置一些来自 OpenStreetMap、MapQuest Open、MapQuest Open Aerial、Mapbox和Stamen 的地图元件(tilesets),并且支持用 Mapbox 或者 Cloudmade API keys 来自定义地图元件。Folium支持 GeoJSON 和 TopJSON 叠加(overlays),绑定数据来创造一个分级统计图(Choropleth map)。但是,Folium库绘制热点图的时候,需要联网才可显示。
特点
Folium 的主要特点包括:
- 简单性:Folium 提供了一个简单易用的接口,使得在 Python 中创建地图变得非常直接。
- 功能丰富:通过 Folium,用户可以添加标记、多边形、圆形、热力图等多种地图元素,还可以自定义样式来美化和定制地图。
- 可扩展性:由于基于 Leaflet,Folium 能够利用 Leaflet 社区丰富的插件来进一步增强地图的功能。
- 集成性:Folium 可以很好地与其他 Python 数据处理库(如 Pandas)集成,方便地从数据集中提取地理信息并将其可视化。
- 导出能力:Folium 可以导出为 HTML 文件,使得创建的地图可以在独立的网页中查看,也可以直接在 Jupyter Notebook 中进行预览。
官方文档:https://python-visualization.github.io/folium/latest/user_guide.html
准备工作
安装
1 | |
demo 示例
直接上代码
1 | |
效果展示,打开该文件就是这个状态,十分方便友好
使用指南
Map
https://python-visualization.github.io/folium/latest/user_guide/map.html
folium.Map 是 Folium 的基本类,每个地图都需要创建这样一个实例
1 | |
可以通过参数设置初始位置、放缩倍数,限制区域等属性
LayerControl
可以向当前 map 添加或控制图层
1 | |
手动展示标记
1 | |
Popups
可以向地图上的标记添加弹出介绍
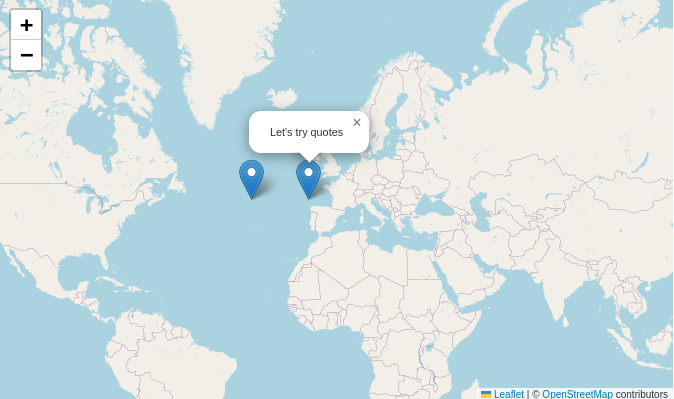
Simple popups
弹出文字信息
1 | |
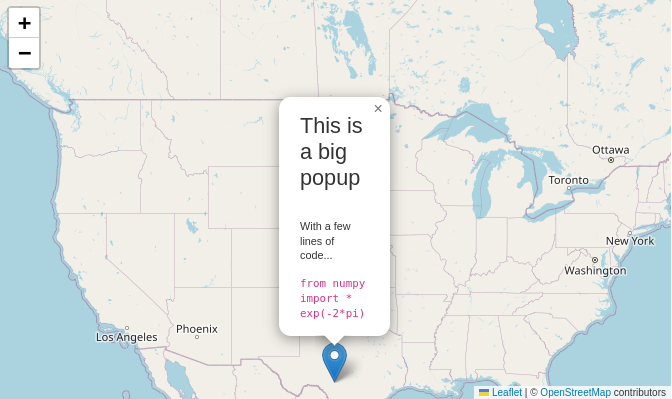
HTML in popup
可以在弹出提示中加入 HTML 元素
1 | |
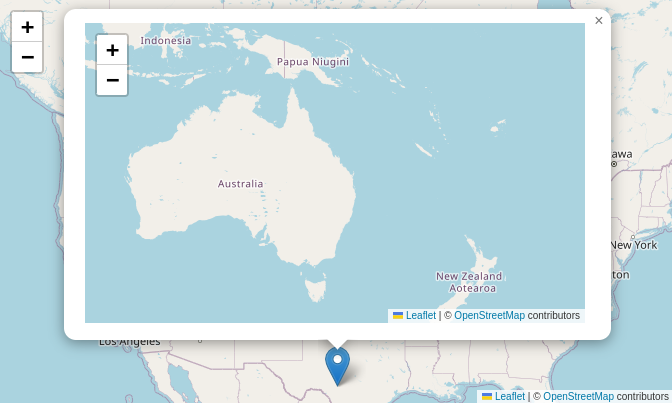
Iframe in popup
也可以将 Iframe 添加进去
1 | |
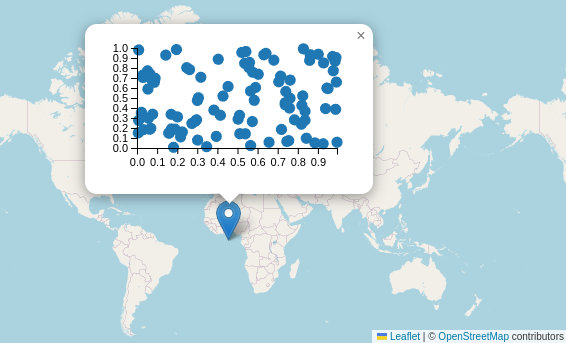
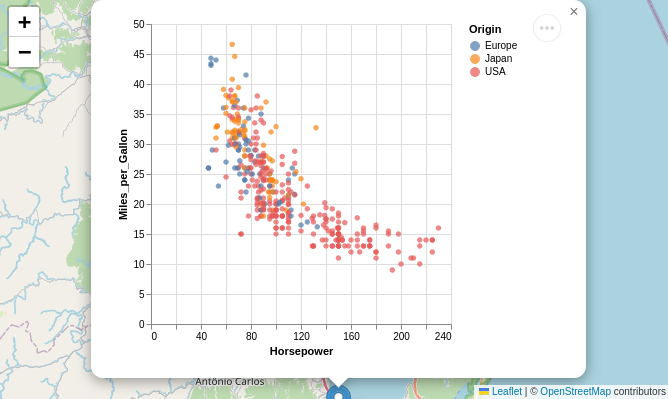
Vega chart in popup
还可以加入 Vega 图表
1 | |
Vega-Lite chart in popup
更高级的 Vega 图表
Vector Layers
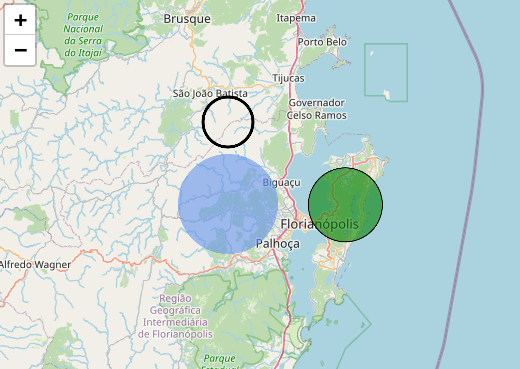
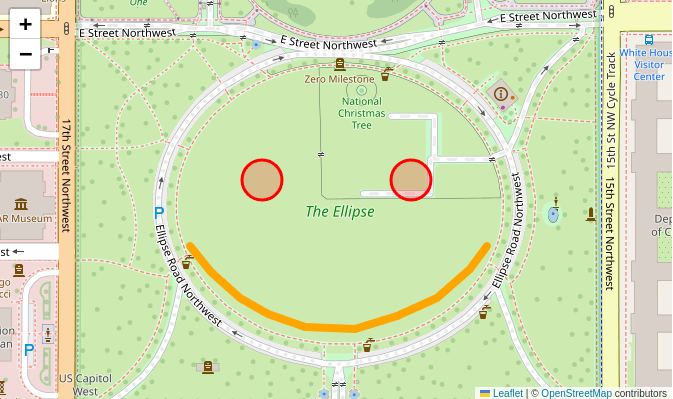
Circle and CircleMarker
CircleMarker 以像素指定半径,而 Circle 以米指定。这意味着当你缩放时,CircleMarker 不会改变你屏幕上的大小,而 Circle 在地图上有一个固定的位置。
1 | |
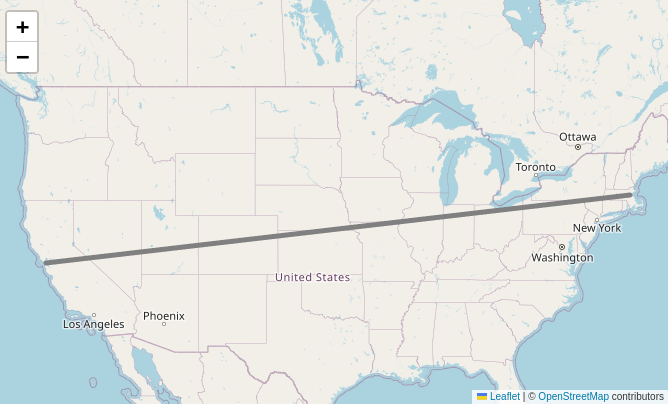
PolyLine
1 | |
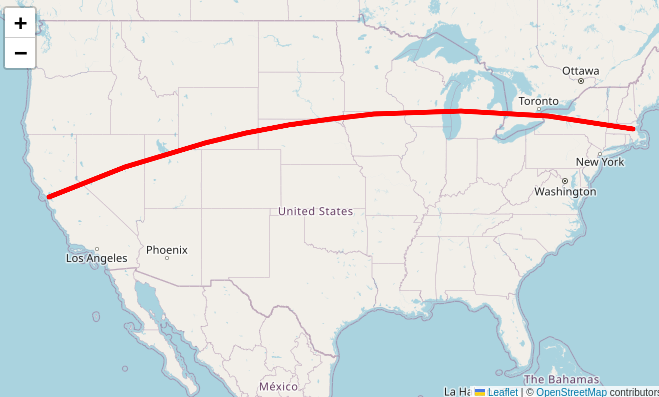
平滑
1 | |
多条线
1 | |
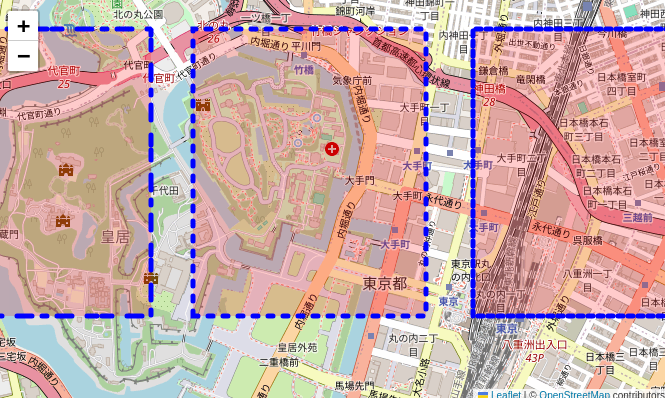
Rectangle
1 | |
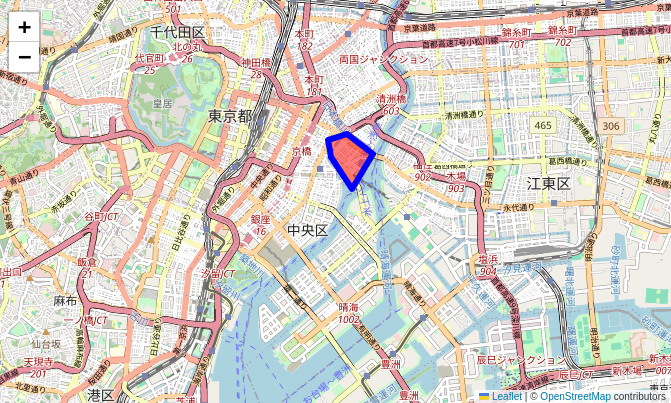
Polygon
1 | |
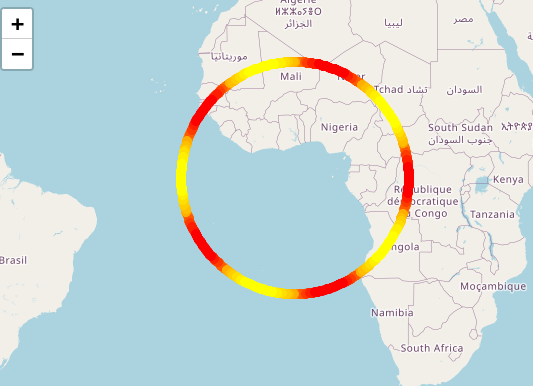
ColorLine
1 | |
更多功能参考:https://python-visualization.github.io/folium/latest/user_guide.html
参考资料
- https://python-visualization.github.io/folium/latest/user_guide.html
- https://zhuanlan.zhihu.com/p/242268152
文章链接:
https://www.zywvvd.com/notes/coding/python/folium/folium/
“觉得不错的话,给点打赏吧 ୧(๑•̀⌄•́๑)૭”

微信支付
支付宝支付